
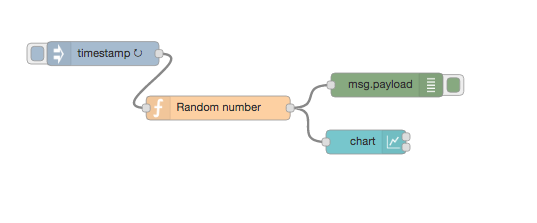
This simple tutorial explains how to display multiple lines on a Node-RED chart. We’ll be building on a previous example in our lecture series (Example 7.2 in lecture 7) As discussed in that lecture, let’s set up a simple flow to generate a random number and display it on a chart.
from Pocket https://ift.tt/xNGTrX7
via IFTTT